
The training—injury prevention paradox:
should athletes be training smarter and harder?
Open Access
Tim J Gabbett1,2
+ Author Affiliations
1School of Exercise Science, Australian Catholic University, Brisbane, Queensland, Australia
2School of Human Movement Studies, University of Queensland, Brisbane, Queensland, Australia
Correspondence to
Dr Tim J Gabbett, School of Exercise Science, Australian Catholic University, 1100 Nudgee Road, Brisbane, QLD 4014, Australia;
tim_gabbett@yahoo.com.au
Accepted 16 November 2015
Published Online First 12 January 2016
Abstract
Background There is dogma that higher training load causes higher injury rates. However, there is also evidence that training has a protective effect against injury. For example, team sport athletes who performed more than 18 weeks of training before sustaining their initial injuries were at reduced risk of sustaining a subsequent injury, while high chronic workloads have been shown to decrease the risk of injury. Second, across a wide range of sports, well-developed physical qualities are associated with a reduced risk of injury. Clearly, for athletes to develop the physical capacities required to provide a protective effect against injury, they must be prepared to train hard. Finally, there is also evidence that under-training may increase injury risk. Collectively, these results emphasise that reductions in workloads may not always be the best approach to protect against injury.
Main thesis This paper describes the ‘Training-Injury Prevention Paradox’ model; a phenomenon whereby athletes accustomed to high training loads have fewer injuries than athletes training at lower workloads. The Model is based on evidence that non-contact injuries are not caused by training per se, but more likely by an inappropriate training programme. Excessive and rapid increases in training loads are likely responsible for a large proportion of non-contact, soft-tissue injuries. If training load is an important determinant of injury, it must be accurately measured up to twice daily and over periods of weeks and months (a season). This paper outlines ways of monitoring training load (‘internal’ and ‘external’ loads) and suggests capturing both recent (‘acute’) training loads and more medium-term (‘chronic’) training loads to best capture the player’s training burden. I describe the critical variable—acute:chronic workload ratio—as a best practice predictor of training-related injuries. This provides the foundation for interventions to reduce players risk, and thus, time-loss injuries.
Summary The appropriately graded prescription of high training loads should improve players’ fitness, which in turn may protect against injury, ultimately leading to (1) greater physical outputs and resilience in competition, and (2) a greater proportion of the squad available for selection each week.
Training–performance relationship
In a British Journal of Sports Medicine blog, Dr John Orchard1 proposed hypothetical relationships between training (both under-training and over-training), injury, fitness and performance. He speculated that both inadequate and excessive training loads would result in increased injuries, reduced fitness and poor team performance (see figure 1). The relationship between training load, injury, fitness and performance is critical to sports medicine/physiotherapy and sport science practitioners. In this paper I use the term ‘practitioners’ to refer to the wide gamut of health professionals and also sport scientists who work with athletes/teams (ie, strength and conditioning coaches, certified personal trainers, etc). Our field—sports performance and sports injury prevention is a multidisciplinary one and this paper is relevant to the field broadly.
Figure 1
Hypothetical relationship between training loads, fitness, injuries and performance. Redrawn from Orchard.1
Injuries impair team performance, but any injuries that could potentially be considered ‘training load-related’ are commonly viewed as ‘preventable’, and therefore the domain of the sport science and medicine team. Sport science (including strength and conditioning) and sports medicine (including doctors and physiotherapists) practitioners share a common goal of keeping players injury free. Sport science and strength and conditioning staff aim to develop resilience through exposing players to physically intense training to prepare players for the physical demands of competition, including the most demanding passages of play.
On the other hand, doctors and physiotherapists are often viewed as the staff responsible for ‘managing players away from injury’. A stereotype is the physiotherapist or doctor advocating to reduce training loads so that fewer players will succumb to ‘load-related’ (eg, overuse) injuries. However, how many of the decisions governing players and their individual training loads are based on empirical evidence or the practitioners’ ‘expert’ intuition (ie, ‘gut feel’)?
Banister et al2 proposed that the performance of an athlete in response to training can be estimated from the difference between a negative function (‘fatigue’) and a positive function (‘fitness’). The ideal training stimulus ‘sweet spot’ is the one that maximises net performance potential by having an appropriate training load while limiting the negative consequences of training (ie, injury, illness, fatigue and overtraining).3
Several studies have investigated the influence of training volume, intensity and frequency on athletic performance, with performance generally improved with increases in training load.4–10 In individual sports (eg, swimming and running) greater training volume,4 ,8 and higher training intensity5 ,6 ,8 improved performance. In a study of 56 runners, cyclists and speed skaters undertaking 12 weeks of training, a 10-fold increase in training load was associated with an approximately 10% improvement in performance.10 In competitive swimmers, significant associations were found between greater training volume (r=0.50–0.80) and higher training intensity (r=0.60–0.70) and improved performance.9 However, adverse events of exercise training are also dose related, with the highest incidence of illness and injury occurring when training loads were highest.10–15
Training loads can be measured in different ways
Sport scientists typically obtain measurements of a prescribed external training load (ie, physical ‘work’), accompanied by an internal training load (ie, physiological or perceptual ‘response’). External training loads may include total distance run, the weight lifted or the number and intensity of sprints, jumps or collisions (to name a few).16 Internal training loads include ratings of perceived exertion and heart rate. The individual characteristics of the athlete (eg, chronological age, training age, injury history and physical capacity) combined with the applied external and internal training loads determine the training outcome.16
For example, identical external training loads could elicit considerably different internal training loads in two athletes with vastly different individual characteristics; the training stimulus may be appropriate for one athlete, but inappropriate (either too high or too low) for another. An overweight, middle-aged male will have very different physiological and perceptual responses to an 800 m effort than a trained runner. Although the external training load is identical, the internal training load will be much higher in the older, unfit individual! As the dose–response to training varies between individuals, training should be prescribed on an individual basis.
External training load—‘tracking’ every metre!
Global positioning systems (GPS) have been a ‘game-changer’ in the monitoring of external loads.17 These devices, which are typically no larger than a mobile phone, are worn by athletes during training and match-play activities. GPS provides information on speed and distances covered, while inertial sensors (ie, accelerometers, gyroscopes) embedded in the devices also provide information on non-locomotor sport-specific activities (eg, jumps in volleyball, collisions in rugby and strokes in swimming).18 Importantly, most of this data can be obtained in ‘real-time’ to ensure athletes are meeting planned performance targets.
Internal training load—the athlete’s perception of effort
The session-rating of perceived exertion (RPE) has been used to quantify the internal training loads of athletes. At the completion of each training session, athletes provide a 1–10 ‘rating’ on the intensity of the session. The intensity of the session is multiplied by the session duration to provide training load. The units are ‘RPE units×minutes’ and in football codes generally range between 300 and 500 units for lower-intensity sessions and 700–1000 units for higher-intensity sessions. For ease, we have referred to them as ‘arbitrary units’ in previous work. A more accurate term might be ‘exertional minutes’. The value of session-RPE will depend on the goal of those measuring it and that topic is beyond the scope of this paper.
Monitoring individual athlete well-being
Monitoring athlete well-being is common practice in high performance sport.19–21 A wide range of subjective questionnaires are used with many of them employing a simple 5, 7 or 10-point Likert scale.19–23 Longer, more time consuming surveys are also employed.24 ,25
These questionnaires are used to determine the readiness of team sport athletes to train. Typically players report their mood, stress level, energy, sleep and diet, along with their feelings of soreness in the upper-body, quadriceps, hamstring, groin and calf. The sum of the questions indicates the athlete’s well-being. Practitioners can then adapt the training prescription for players on an individual basis (eg, continue regular training, investigate training loads or modify training programme).
Relationship between training loads and injury
Training load monitoring is increasingly popular in high performance sport to ensure athletes achieve an adequate training stimulus and to minimise the negative consequences of training (injury risk, overtraining). In the following section, I discuss the relationship between training loads (both internal and external loads) and injury in team sport athletes.
External workloads and injury
In elite rugby league, players who performed greater amounts (>9 m) of very high-speed (>7 m/s) running per session were 2.7 times more likely to sustain a non-contact, soft-tissue injury than players who performed less very high-speed running per session (table 1).26 This ‘threshold’ of 9 m of very high-speed running is lower than what would typically be performed in other team sport training sessions (eg, soccer and Australian football),27 and likely reflects the greater contact and repeated-effort demands, and lower running demands of rugby league.27 For example, in studies of Australian football players, higher 3-weekly total distance (73 721–86 662 m, OR=5.5) and 3-weekly sprint distance (>1453 m, OR=3.7) were associated with a greater risk of injury.13
Table 1 – Relationship between external workloads and risk of injury in elite rugby league players
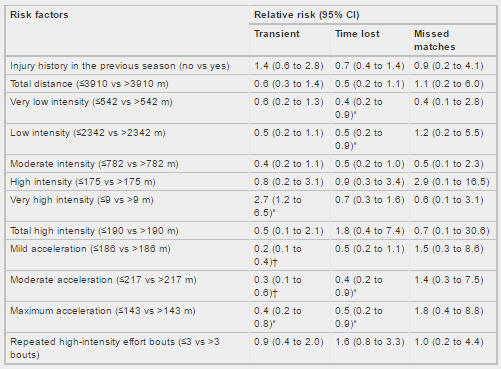
All injuries were classified as a transient (no training missed), time loss (any injury resulting in missed training) or a missed match (any injury resulting in a subsequent missed match) injury. *p < 0.05; †p < 0.01.
Although external loads are commonly measured using GPS devices, some team sports expose athletes to physically demanding external loads that require very little high-speed running (eg, baseball pitching, cricket fast bowling). Of the studies that have been performed in baseball,28–30 greater pitch counts were associated with greater injury rates. Youth pitchers who threw over 100 innings in a season, had 3.5 times greater injury risk than players who pitched fewer than 100 pitches.30
Similar findings have been observed in cricket players; fast bowlers who bowled more than 50 overs in a match were at increased risk of injury for up to 28 days (OR=1.62).31 Furthermore, bowlers who bowled more deliveries in a week (>188 deliveries, relative risk=1.4) and had less recovery between sessions (< 2 days, relative risk=2.4) were at greater injury risk than those who bowled between 123 and 188 deliveries per week and had 3–3.99 days recovery between sessions. Complicating this issue is that bowlers who bowled fewer deliveries each week (< 123 deliveries, relative risk=1.4) and had greater recovery (>5 days, relative risk=1.8) were also at increased risk of injury.32
Internal workloads and injury
These findings on external loads are consistent with results from studies on internal loads; higher training loads were associated with greater injury rates.11 ,15 ,33–36 In early work11 a strong relationship (r=0.86) was reported between training loads (derived from the session-RPE) and training injury rates across a playing season in semiprofessional rugby league players (figure 2). Furthermore, over a 3-year period, reduced training loads markedly reduced injury rates in the same cohort of players (figure 3).37 It is likely that excessive training loads performed early in the study, led to overtraining, resulting in a spike in injury rates. However, it should be noted that this study was published over 10 years ago, and no subsequent study has replicated these results.
Figure 2
Relationship between training load and injury rate in team sport athletes. Training loads were measured using the session-rating of perceived exertion method. Redrawn from Gabbett.11
Figure 3
Influence of reductions in preseason training loads on injury rates and changes in aerobic fitness in team sport athletes. Training loads
were measured using the session-rating of perceived exertion method. Redrawn from Gabbett.37
In professional rugby union players, higher 1-week (>1245 arbitrary units) and 4-week cumulative loads (>8651 arbitrary units) were
associated with a higher risk of injury.14 In professional rugby league players, training load was associated with overall injury (r=0.82),
non-contact field injury (r=0.82), and contact field injury (r=0.80) rates.35 Significant relationships were also observed between the field
training load and overall field injury (r=0.68), non-contact field injury (r=0.65), and contact field injury (r=0.63) rates. Strength and
power training loads were significantly related to the incidence of strength and power injuries (r=0.63). There was no significant
relationship between field training loads and the incidence of strength and power injuries. However, strength and power training loads were
significantly associated with the incidence of contact (r=0.75) and non-contact (r=0.87) field training injuries. Collectively, these
findings suggest that (1) the harder rugby league players train, the more injuries they will sustain and (2) high strength and power
training loads may contribute indirectly to field injuries. Monitoring of training loads and careful scheduling of field and gymnasium
sessions to avoid residual fatigue is warranted to minimise the effect of training-related injuries on professional rugby league players.
Differences in training adaptations between younger and older athletes
The age of the athlete influences adaptations to training.38 ,39 Gabbett38 investigated training loads, injury rates and physical
performance changes associated with a 14-week field conditioning programme in junior (approximately 17 years) and senior (approximately 25
years) rugby league players. Training improved muscular power and maximal aerobic power in the junior and senior players, however the
improvement in muscular power and maximal aerobic power were greatest in the junior players. Training loads and injury rates were higher in
the senior players. Thus, junior and senior rugby league players may adapt differently to a given training stimulus, suggesting that
training programmes should be modified to accommodate differences in training age.
Rogalski et al39 also showed that at a given training load, older and more experienced (7+ years’ experience in the Australian Football
League competition) players were at greater risk of injury than less experienced, younger (1–3 years’ experience in the Australian Football
League competition) players. It is likely that the higher training injury risk in the more experienced players is confounded by previous
injury which is a major risk factor for a new injury.40 Older players likely had experienced a greater number of injuries across the course
of their careers than the less experienced first to third year players. Clearly, further research investigating the dose–response
relationship between training and injury in athletes of different ages and genders is warranted.41
Modelling the training load–injury relationship and using it to predict injury
This section focuses on the use of training monitoring to model the relationship between load and injury risk.
Over a 2-year period, Gabbett42 used the session-RPE to model the relationship between training loads and the likelihood of injury in elite rugby league players. Training load and injury data were modelled using a logistic regression model with a binomial distribution (injury vs no injury) and logit link function, with data divided into preseason, early competition and late competition phases.
Players were 50–80% likely to sustain a preseason injury within the weekly training load range of 3000 to 5000 arbitrary minutes (RPE×minutes, as above). These training load ‘thresholds’ for injury were considerably lower (1700–3000 session-RPE units/week) in the competitive phase of the season. Importantly, on the steep portion of the sigmoidal training load-injury curve, very small changes in training load resulted in very large changes in injury risk (figure 4).

Figure 4
Relationships between training load, training phase, and likelihood of injury in elite team sport athletes. Training loads were measured using the session-rating of perceived exertion method. Players were 50–80% likely to sustain a preseason injury within the training load range of 3000–5000 arbitrary units. These training load ‘thresholds’ were considerably reduced (1700–3000 arbitrary units) in the competitive phase of the season (indicated by the arrow and shift of the curve to the left). On the steep portion of the preseason training load-injury curve (indicated by the grey-shaded area), very small changes in training load result in very large changes in injury risk. Pre-Season Model: Likelihood of Injury=0.909327/(1+exp(−(Training Load−2814.85)/609.951)). Early Competition Model: Likelihood of Injury=0.713272×(1−exp(−0.00038318×Training Load)). Late Competition Model: Likelihood of Injury=0.943609/(1+exp(−(Training Load−1647.36)/485.813)). Redrawn from Gabbett.42Training load and injury data were prospectively recorded over a further two competitive seasons in those elite rugby league players. An injury prediction model based on planned and actual training loads was developed and implemented to determine if non-contact, soft-tissue injuries could be predicted. One-hundred and fifty-nine non-contact, soft-tissue injuries were sustained over those two seasons. The percentage of true-positive predictions was 62% (N=121) and the false-positive and false-negative predictions were 13% (N=20) and 11% (N=18), respectively. Players who exceeded the weekly training load threshold were 70 times more likely to test positive for non-contact, soft-tissue injury, while players who did not exceed the training load threshold were injured 1/10 as often (table 2). Furthermore, following the introduction of this model, the incidence of non-contact, soft-tissue injuries was halved.42
Table 2 – Accuracy of model for predicting non-contact, soft-tissue injuries
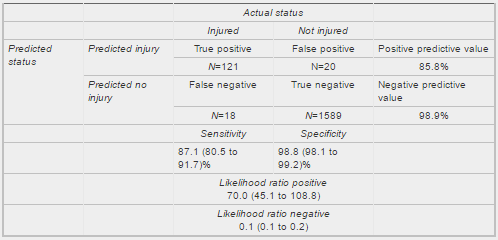
‘True Positive’—predicted injury and player sustained injury; ‘False Positive’—predicted injury but player did not sustain injury; ‘False
Negative’—no injury predicted but player sustained injury; ‘True Negative’—no injury predicted and player did not sustain injury.
‘Sensitivity’—proportion of injured players who were predicted to be injured; Specificity—proportion of uninjured players who were predicted
to remain injury-free. ‘Likelihood ratio positive’—sensitivity/(1−specificity); ‘Likelihood ratio negative’—(1−sensitivity)/specificity.
While there were 91 players in the sample, injury predictions based on the training loads performed by individual players were made on a
weekly basis, so that within the total cohort, there was a total number of true positive and negative predictions, and a total number of
false positive and negative predictions. Sensitivity and specificity data, and positive and negative likelihood ratios are expressed as
rates (and 95% CIs).
Reproduced from Gabbett.42
Table 2 – Accuracy of model for predicting non-contact, soft-tissue injuries
We also analysed the prevalence of injury and the predictive ratios obtained from the model. The prevalence of injury in this sample of professional rugby league players was 8.6%. If the predictive equation was positive for a given player, the likelihood of injury increased from 8.6% to 86%, and if the results of the test were negative, the likelihood of injury decreased from 8.6% to 0.1%. Furthermore, 87% (121 from 139 injuries) of the 8.6% of players who sustained an injury were correctly identified by the injury prediction model.Although several commercially available software programs claim to predict training load-related injuries, to date, this is the only study to predict injury based on training load data, apply that model in a high performance sporting environment, and then report the results in a peer-reviewed journal. We acknowledge that any regression model that predicts injury is best suited to the population from which it is derived. Caution should be applied when extrapolating these results to other sports and populations. Despite this potential limitation, these findings provide information on the training dose–response relationship in elite rugby league players, and a scientific method of monitoring and regulating training load in these athletes. Importantly, in a team environment, this approach allows players to be managed on an individual basis.
The critical element of week-to-week change (usually increases!) in training load
Accepting that high absolute training loads are associated with greater injury risk,42 strength and conditioning practitioners must also consider how week-to-week changes in training load independently influence injury risk (aside from total training load). In a study of Australian football players, Piggott et al34 showed that 40% of injuries were associated with a rapid change (>10%) in weekly training load in the preceding week. Rogalski et al39 also showed that larger 1-weekly (>1750 arbitrary units, OR=2.44–3.38), 2-weekly (>4000 arbitrary units, OR=4.74) and previous to current week changes in internal load (>1250 arbitrary units, OR=2.58) were related to a greater risk of injury. Large week-to-week changes in training load (1069 arbitrary units) also increased the risk of injury in professional rugby union players.14 We have also modelled the relationship between changes in weekly training load (reported as a percentage of the previous weeks’ training load) and the likelihood of injury (unpublished observations). When training load was fairly constant (ranging from 5% less to 10% more than the previous week) players had <10% risk of injury (figure 5). However, when training load was increased by ≥15% above the previous week's load, injury risk escalated to between 21% and 49%. To minimise the risk of injury, practitioners should limit weekly training load increases to < 10%.

Figure 5
Likelihood of injury with different changes in training load. Unpublished data collected from professional rugby league players over three preseason preparation periods. Training loads were measured using the session-rating of perceived exertion method. Training loads were progressively increased in the general preparatory phase of the preseason (ie, November through January) and then reduced during the specific preparatory phase of the preseason (ie, February). The training programme progressed from higher volume-lower intensity activities in the general preparatory phase to lower volume-higher intensity activities in the specific preparatory phase. Each player participated in up to five organised field training sessions and four gymnasium-based strength and power sessions per week. Over the three preseasons, 148 injuries were sustained. Data are reported as likelihoods ±95% CIs.Considering both acute and chronic training load: a better way to model the training–injury relationship?
Is there a benefit in modelling the training–injury relationship using a combination of both acute and chronic training loads? Acute training loads can be as short as one session, but in team sports, 1 week of training appears to be a logical and convenient unit. Chronic training loads represent the rolling average of the most recent 3–6 weeks of training. In this respect, chronic training loads are analogous to a state of ‘fitness’ and acute training loads are analogous to a state of ‘fatigue’.2
Comparing the acute training load to the chronic training load as a ratio provides an index of athlete preparedness. If the acute training load is low (ie, the athlete is experiencing minimal ‘fatigue’) and the rolling average chronic training load is high (ie, the athlete has developed ‘fitness’), then the athlete will be in a well-prepared state. The ratio of acute:chronic workload will be around 1 or less. Conversely, if the acute load is high (ie, training loads have been rapidly increased resulting in ‘fatigue’) and the rolling average chronic training load is low (ie, the athlete has performed inadequate training to develop ‘fitness’), then the athlete will be in a fatigued state. In this case the ratio of the acute:chronic workload will exceed 1. The use of the acute:chronic workload ratio emphasises both the positive and negative consequences of training. More importantly, this ratio considers the training load that the athlete has performed relative to the training load that he or she has been prepared for.43
The first study to investigate the relationship between the acute:chronic workload ratio and injury risk was performed on elite cricket fast bowlers.43 Training loads were estimated from both session-RPE and balls bowled. When acute workload was similar to, or lower than the chronic workload (ie, acute:chronic workload ratio ≤0.99) the likelihood of injury for fast bowlers in the next 7 days was approximately 4%. However, when the acute:chronic workload ratio was ≥1.5 (ie, the workload in the current week was 1.5 times greater than what the bowler was prepared for), the risk of injury was 2–4 times greater in the subsequent 7 days.43
Using total weekly distance as a predictor variable, almost identical results have been found in elite rugby league44 and soccer45 players; ‘spikes’ in acute load relative to chronic load (ie, when the acute:chronic workload ratio exceeded 1.5) were associated with an increased risk of injury.
Taken from three different sports (cricket, Australian football and rugby league), a guide to interpreting and applying acute:chronic workload ratio data is shown in figure 6.46 In terms of injury risk, acute:chronic workload ratios within the range of 0.8–1.3 could be considered the training ‘sweet spot’, while acute:chronic workload ratios ≥1.5 represent the ‘danger zone’. To minimise injury risk, practitioners should aim to maintain the acute:chronic workload ratio within a range of approximately 0.8–1.3. It is possible that different sports will have different training load–injury relationships; until more data is available, applying these recommendations to individual sport athletes should be performed with caution.

Figure 6
Guide to interpreting and applying acute:chronic workload ratio data. The green-shaded area (‘sweet spot’) represents acute:chronic workload ratios where injury risk is low. The red-shaded area (‘danger zone’) represents acute:chronic workload ratios where injury risk is high. To minimise injury risk, practitioners should aim to maintain the acute:chronic workload ratio within a range of approximately 0.8–1.3. Redrawn from Blanch and Gabbett.46
The balance between injury prevention and high performance: training too much or not training enough
Successful sporting teams report lower injury rates and greater player availability than unsuccessful teams.47–49 Although the evidence linking greater training loads with high injury rates is compelling, focusing on the negative aspects of training detracts from the many positive adaptations that arise from the training process. In addition, there are several reasons why the results linking high training loads to injury should be taken in context with the wide range of performance issues relevant to sport. Wrapping players in cotton wool will not bring on-field success. How can practitioners help coaches train players at the ideal level (maximising performance while also maintaining a low risk of non-contact soft-tissue injuries)?
Does this mean athletes should stop training?!
Although studies have shown a positive relationship between training load and injury, there is also evidence demonstrating that training has a protective effect against injury. The results of these studies should be considered when evaluating the influence of high training workloads on injury risk:
Team sport athletes who performed greater than 18 weeks of training before sustaining their initial injuries were at reduced risk of sustaining a subsequent injury.50 These findings are consistent with others43 ,44 who have shown that high chronic workloads may decrease the risk of injury. Furthermore, greater training prior to entering an elite junior soccer programme was associated with a decreased risk of developing groin pain.51
Second, across a wide range of sports, well-developed physical qualities are associated with a reduced risk of injury.50 ,52–54 Clearly, for athletes to develop the physical capacities required to provide a protective effect against injury, they must be prepared to train hard.
Importantly, there is evidence that over-training and under-training may increase injury risk.14 ,28 ,32 For example, cricket fast bowlers who bowled fewer deliveries per week with greater recovery between sessions were at an increased risk of injury, while bowlers who bowled more deliveries per week with less recovery between sessions were also at an increased risk of injury. Similar findings have been reported in baseball and rugby union.14 ,28 The ‘U’-shaped relationship between workload and injury from these data demonstrate that both inadequate and excessive workloads are associated with injury.
Collectively, these results emphasise that reductions in workloads may not always be the best approach to protect against injury. How do practitioners find the ‘sweet spot’ of training load?
Training smarter and harder—the mechanisms that may underpin these findings
Although high training loads have been associated with higher injury rates, results are equivocal with recent evidence also demonstrating a protective effect of high chronic training loads.43 ,44 In this section I elaborate on the data shown in tables 1 and 2. Table 1 above shows that players who performed greater amounts of very high-speed running were 2.7 times more likely to sustain a non-contact soft-tissue injury than players with lower running loads.26 Given the high risk of injury with greater running loads, it is tempting to suggest that athletes should avoid very high-speed running in training to minimise the risk of injury. However, by restricting running loads in an attempt to reduce injury risk, it is possible that during critical passages of play when players are required to exert maximally they are inadvertently put at greater risk of injury due to being under prepared.
Greater amounts of very high-speed running may be associated with increased injury risk, however there is evidence (from the same data set) of lower injury risk when players performed greater amounts of low-intensity activity and short acceleration efforts.26 High-intensity team sports such as soccer, basketball and the rugby codes require players to perform short (2–3 s) acceleration efforts,55 followed by longer durations of lower intensity activity.56 In competition, longer high-speed efforts are uncommon.57
Given that high training loads can be achieved in different ways (ie, volume, intensity and frequency of training, as well as the balance of training activities performed) it is inappropriate to consider all ‘high training loads’ as carrying identical injury risk. To be explicit, ‘high training loads’ per se may not be the largest contributing factor to increased injury risk, but rather the type of ‘high training load’ that is prescribed may be an important predictor of injury. Greater amounts of short, high-intensity acceleration effort training and game-specific aerobic activity may provide team sport athletes with the appropriate physical qualities to not only perform at a high level, but also protect against injury.
Table 2 illustrates the accuracy of an injury prediction model. It demonstrates that the training load model was both sensitive and specific for predicting non-contact, soft tissue injuries. However, the injury prediction model was far better at identifying when injuries were unlikely to occur (ie, true negatives) than it was at predicting injuries. These findings are intuitive; if performance staff focus on injury prevention, and prevent injuries through ‘managing athletes away from training’, then the low numbers of training-load related injuries may be expected, as athletes are unlikely to ever train with adequate volumes or intensities to sustain an injury.
Equally, note that in figure 4, on the steep portion of the training load–injury curve small changes in training load (either increases or decreases) result in large changes in injury risk (in the respective direction). Under-emphasised in this study, was that due to the sigmoidal nature of the curve, at large training loads the training load–injury relationship is almost completely ‘flat’. On this portion of the curve, large changes in training load result in very small changes in injury risk. Thus, if athletes can safely train through the ‘high risk’ portions of the curve (using the acute:chronic workload ratio model), then they may develop greater resilience and training tolerance.
Although injury prediction models may have sufficient predictive accuracy to warrant systematic use in an elite team sport programme, a fine balance exists between training, detraining and overtraining. Training programmes must be physiologically and psychologically appropriate58 to allow players to cope with the demands of competition. With this in mind, it may be argued that it is worthwhile using preseason training and training camps to prescribe high training loads (note, not excessive) to determine which players are most susceptible to injury under physically stressful situations (these players most likely will not tolerate the intensity and fatigue of competition), and which players are not susceptible to injury under physically stressful situations (these players are more likely to tolerate the intensity and fatigue of competition).
A new view of training—a ‘vaccine’ against injuries!
This paper proposes the training-injury prevention paradox. Physically hard (and appropriate) training may protect against injuries. There is no disputing that high training loads are generally associated with better developed fitness and thus, good performance. One cost of high training load is often considered to be soft tissue injury risk. To address this risk, training loads could be reduced to decrease the incidence of injury, however low training loads (in the form of reduced training volumes) have also been associated with increased injury risk; exposing players to low training loads may place them at risk of further injury. Once players enter the rehabilitation process, it is a challenge for practitioners to expose them to appropriate loads to enhance physical qualities which provide a protective effect against injury, and prevent the ‘spike’ in loads when players return to full training. As a result, it is not uncommon for teams to have a constant ‘rehab-er’ in their squad—a player who breaks down repeatedly (potentially with different injuries) because his or her training load is not high enough to adapt to match demands. The data presented suggest that prescribing high training loads can lead to improved levels of fitness, which in turn offers a protective effect against injury, ultimately leading to (1) greater physical outputs and resilience in competition, and (2) a greater proportion of the squad available for selection each week (figure 7).

Figure 7 – Relationship between physical qualities, training load, and injury risk in team sport athletes.
Conclusions
In conclusion, while there is a relationship between high training loads and injury, this paper demonstrates that the problem is not with training per se, but more likely the inappropriate training that is being prescribed. Excessive and rapid increases in training loads are likely responsible for a large proportion of non-contact, soft-tissue injuries. However, physically hard (and appropriate) training develops physical qualities, which in turn protects against injuries. This paper highlights the importance of monitoring training load, including the load that athletes are prepared for (by calculating the acute:chronic workload ratio), as a best practice approach to the long-term reduction of training-related injuries.
What are the findings?
Dogma exists around the effects of high (and low) training loads on injury.
This review highlights the positive and negative effects of high training loads on injury risk, fitness and thus, performance.
There is a relationship between high training loads and injuries but well-developed physical qualities protect against injury.
The ratio of acute to chronic training load is a better predictor of injury than acute or chronic loads in isolation.
How might it impact on clinical practice in the future?
In many high performance settings, training loads are reported on a week-to-week basis. Recording acute and chronic training loads, and modelling the acute:chronic workload ratio allows practitioners to determine if athletes are in a state of ‘fitness’ (ie, net training recovery, lower than average risk of injury) or ‘fatigue’ (ie, net training stress, higher than average risk of injury).
The Training-Injury Prevention Paradox Model allows practitioners to monitor and prescribe training to team sport athletes on an individual basis.
Providing evidence around the effects of acute and chronic training load on injury risk, physical fitness and performance will allow practitioners to systematically prescribe high training loads while minimising the risk of athletes sustaining a ‘load-related’ injury.
References
↵ Orchard J. Who is to blame for all the football injuries? Br J Sports Med 2012; June 20, guest blog. http://blogs.bmj.com.dbgw.lis.curtin.edu.au/bjsm/2012/06/20/who-is-to-blame-for-all-the-football-injuries/
↵ Banister EW, Calvert TW, Savage MV, et al. A systems model of training for athletic performance. Aust J Sports Med 1975;7:57–61. Google Scholar
↵ Morton RH. Modeling training and overtraining. J Sports Sci 1997;15:335–40. doi:10.1080/026404197367344 [CrossRef][Medline][Web of Science]Google Scholar
↵ Foster C, Daniels JT, Yarbrough RA. Physiological and training correlates of marathon running performance. Aust J Sports Med 1977;9:58–61. Google Scholar
↵ Krebs PS, Zinkgraf S, Virgilio SJ. Predicting competitive bicycling performance with training and physiological variables. J Sports Med Phys Fit 1986;26:323–30. [Medline]Google Scholar
↵ Mujika I, Chatard JC, Busso T, et al. Effects of training on performance in competitive swimming. Can J Appl Physiol 1995;20:395–406. doi:10.1139/h95-031 [CrossRef][Medline]Google Scholar
↵ Mujika I, Busso T, LaCoste L, et al. Modeled responses to training and taper in competitive swimmers. Med Sci Sports Exerc 1996;28:251–8. doi:10.1097/00005768-199602000-00015 [CrossRef][Medline][Web of Science]Google Scholar
↵ Scrimgeour AG, Noakes TD, Adams B, et al. The influence of weekly training distance on fractional utilization of maximum aerobic capacity in marathon and ultramarathon runners. Eur J Appl Physiol 1986;55:202–9. doi:10.1007/BF00715006 [CrossRef][Web of Science]Google Scholar
↵ Stewart AM, Hopkins WG. Seasonal training and performance of competitive swimmers. J Sports Sci 2000;18:873–84. doi:10.1080/026404100750017805 [CrossRef][Medline]Google Scholar
↵ Foster C. Monitoring training in athletes with reference to overtraining syndrome. Med Sci Sports Exerc 1998;30:1164–8. doi:10.1097/00005768-199807000-00023 [CrossRef][Medline][Web of Science]Google Scholar
↵ Gabbett TJ. Influence of training and match intensity on injuries in rugby league. J Sports Sci 2004;22:409–17. doi:10.1080/02640410310001641638 [CrossRef][Medline][Web of Science]Google Scholar
↵ Huxley DJ, O’Connor D, Healey PA. An examination of the training profiles and injuries in elite youth track and field athletes. Eur J Sport Sci 2014;14: 185–92. doi:10.1080/17461391.2013.809153 [CrossRef][Medline]Google Scholar
↵ Colby MJ, Dawson B, Heasman J, et al. Accelerometer and GPS-derived running loads and injury risk in elite Australian footballers. J Strength Cond Res 2014;28:2244–52. doi:10.1519/JSC.0000000000000362 [CrossRef][Medline]Google Scholar
↵ Cross MJ, Williams S, Trewartha G, et al. The influence of in-season training loads on injury risk in professional rugby union. Int J Sports Physiol Perform 2015 (in press). doi:10.1123/ijspp.2015-0187 Google Scholar
↵ Anderson L, Triplett-McBride T, Foster C, et al. Impact of training patterns on incidence of illness and injury during a women’s collegiate basketball season. J Strength Cond Res 2003;17:734–8. [CrossRef][Medline][Web of Science]Google Scholar
↵ Impellizzeri FM, Rampinini E, Marcora SM. Physiological assessment of aerobic training in soccer. J Sports Sci 2005;23:583–92. doi:10.1080/02640410400021278 [CrossRef][Medline]Google Scholar
↵ Cummins C, Orr R, O’Connor H, et al. Global positioning systems (GPS) and microtechnology sensors in team sports: a systematic review. Sports Med 2013;43:1025–42. doi:10.1007/s40279-013-0069-2 [CrossRef][Medline]Google Scholar
↵ Chambers R, Gabbett TJ, Cole MH, et al. The use of wearable microsensors to quantify sport-specific movements. Sports Med 2015;45:1065–81. doi:10.1007/s40279-015-0332-9 [CrossRef][Medline]Google Scholar
↵ Gastin PB, Meyer D, Robinson D. Perceptions of wellness to monitor adaptive responses to training and competition in elite Australian football. J Strength Cond Res 2013;27:2518–26. doi:10.1519/JSC.0b013e31827fd600 [CrossRef][Medline]Google Scholar
↵ Wehbe GM, Gabbett TJ, Hartwig TB, et al. Reliability of a cycle ergometer peak power test in running-based team sport athletes: a technical report. J Strength Cond Res 2015;29:2050–5. doi:10.1519/JSC.0000000000000814 [CrossRef][Medline]Google Scholar
↵ McNamara DJ, Gabbett TJ, Naughton G, et al. Physical preparation and competition workloads and fatigue responses of elite junior cricket players. Int J Sports Physiol Perform 2013;8:517–26. [Medline]Google Scholar
↵ Gallo T, Cormack S, Gabbett T, et al. Characteristics impacting on session rating of perceived exertion training load in Australian footballers. J Sports Sci 2015;33:467–75. doi:10.1080/02640414.2014.947311 [CrossRef][Medline]Google Scholar
↵ Johnston RD, Gabbett TJ, Jenkins DG. Influence of an intensified competition on fatigue and match performance in junior rugby league players. J Sci Med Sport 2013;16:460–5. doi:10.1016/j.jsams.2012.10.009 [CrossRef][Medline]Google Scholar
↵ Kellmann M, Kallus KW. The recovery-stress questionnaire for athletes: user manual. Champaign, IL: Human Kinetics, 2001. Google Scholar
↵ Main L, Grove JR. A multi-component assessment model for monitoring training distress among athletes. Eur J Sport Sci 2009;9:195–202. doi:10.1080/17461390902818260 [CrossRef]Google Scholar
↵ Gabbett TJ, Ullah S. Relationship between running loads and soft-tissue injury in elite team sport athletes. J Strength Cond Res 2012;26:953–60. doi:10.1519/JSC.0b013e3182302023 [CrossRef][Medline]Google Scholar
↵ Varley MC, Gabbett T, Aughey RJ. Activity profiles of professional soccer, rugby league and Australian football match play. J Sports Sci 2014;32: 1858–66. doi:10.1080/02640414.2013.823227 [CrossRef][Medline]Google Scholar
↵ Lyman S, Fleisig GS, Waterbor J, et al. Longitudinal study of elbow and shoulder pain in youth baseball pitchers. Med Sci Sports Exerc 2001;33:1803–10. doi:10.1097/00005768-200111000-00002 [CrossRef][Medline][Web of Science]Google Scholar
↵ Lyman S, Fleisig GS, Andrews JR, et al. Effect of pitch type, pitch count, and pitching mechanics on risk of elbow and shoulder pain in youth baseball pitchers. Am J Sports Med 2002;30:463–8. [Abstract/FREE Full text]
↵ Fleisig GS, Andrews JR, Cutter GR, et al. Risk of serious injury for young baseball pitchers: a 10-year prospective study. Am J Sports Med 2011;39: 253–7. doi:10.1177/0363546510384224 [Abstract/FREE Full text]
↵ Orchard JW, James T, Portus M, et al. Fast bowlers in cricket demonstrate up to 3- to 4-week delay between high workloads and increased risk of injury. Am J Sports Med 2009;37:1186–92. doi:10.1177/0363546509332430 [Abstract/FREE Full text]
↵ Dennis R, Farhart P, Goumas C, et al. Bowling workload and the risk of injury in elite cricket fast bowlers. J Sci Med Sport 2003;6:359–67. doi:10.1016/S1440-2440(03)80031-2 [CrossRef][Medline][Web of Science]Google Scholar
↵ Gabbett TJ, Domrow N. Relationships between training load, injury, and fitness in sub-elite collision sport athletes. J Sports Sci 2007;25:1507–19. doi:10.1080/02640410701215066 [CrossRef][Medline][Web of Science]Google Scholar
↵ Piggott B, Newton MJ, McGuigan MR. The relationship between training load and incidence of injury and illness over a pre-season at an Australian Football League club. J Aust Strength Cond 2009;17:4–17. Google Scholar
↵ Gabbett TJ, Jenkins DG. Relationship between training load and injury in professional rugby league players. J Sci Med Sport 2011;14:204–9. doi:10.1016/j.jsams.2010.12.002 [CrossRef][Medline]Google Scholar
↵ Killen NM, Gabbett TJ, Jenkins DG. Training loads and incidence of injury during the preseason in professional rugby league players. J Strength Cond Res 2010;24:2079–84. doi:10.1519/JSC.0b013e3181ddafff [CrossRef][Medline]Google Scholar
↵ Gabbett TJ. Reductions in pre-season training loads reduce training injury rates in rugby league players. Br J Sports Med 2004;38:743–9. doi:10.1136/bjsm.2003.008391 [Abstract/FREE Full text]
↵ Gabbett TJ. Performance changes following a field conditioning program in junior and senior rugby league players. J Strength Cond Res 2006;20: 215–21. doi:10.1519/R-16554.1 [Medline]Google Scholar
↵ Rogalski B, Dawson B, Heasman J, et al. Training and game loads and injury risk in elite Australian footballers. J Sci Med Sport 2013;16:499–503. doi:10.1016/j.jsams.2012.12.004 [CrossRef][Medline]Google Scholar
↵ Fulton J, Wright K, Zebrosky B, et al. Injury risk is altered by previous injury: a systematic review of the literature and presentation of causative neuromuscular factors. Int J Sports Phys Ther 2014;9:583–95. [Medline]Google Scholar
↵ Gabbett TJ, Whyte DG, Hartwig TB, et al. The relationship between workloads, physical performance, injury and illness in adolescent male football players. Sports Med 2014;44:989–1003. doi:10.1007/s40279-014-0179-5 [CrossRef][Medline]Google Scholar
↵ Gabbett TJ. The development and application of an injury prediction model for non-contact, soft-tissue injuries in elite collision sport athletes. J Strength Con Res 2010;24:2593–603. doi:10.1519/JSC.0b013e3181f19da4 [CrossRef]Google Scholar
↵ Hulin BT, Gabbett TJ, Blanch P, et al. Spikes in acute workload are associated with increased injury risk in elite cricket fast bowlers. Br J Sports Med 2014;48:708–12. doi:10.1136/bjsports-2013-092524 [Abstract/FREE Full text]
↵ Hulin BT, Gabbett TJ, Lawson DW, et al. The acute:chronic workload ratio predicts injury: high chronic workload may decrease injury risk in elite rugby league players. Br J Sports Med 2016;50:231–6.doi:10.1136/bjsports-2015-094817 [Abstract/FREE Full text]
↵ Ehrmann FE, Duncan CS, Sindhusake D, et al. GPS and injury prevention in professional soccer. J Strength Cond Res 2015 (in press). doi:10.1519/JSC.0000000000001093 Google Scholar
↵ Blanch P, Gabbett TJ. Has the athlete trained enough to return to play safely? The acute:chronic workload ratio permits clinicians to quantify a player’s risk of subsequent injury. Br J Sports Med Published Online First: 23 Dec 2015. doi:10.1136/bjsports-2015-095445doi:10.1136/bjsports-2015-095445 Google Scholar
↵ Arnason A, Sigurdsson SB, Gudmundsson A, et al. Physical fitness, injuries, and team performance in soccer. Med Sci Sports Exerc 2004;36:278–85. doi:10.1249/01.MSS.0000113478.92945.CA [CrossRef][Medline][Web of Science]Google Scholar
↵ Hagglund M, Walden M, Magnusson H, et al. Injuries affect team performance negatively in professional football: an 11-year follow-up of the UEFA Champions League injury study. Br J Sports Med 2013;47:738–42. doi:10.1136/bjsports-2013-092215 [Abstract/FREE Full text]
↵ Eirale C, Tol JL, Farooq A, et al. Low injury rate strongly correlates with team success in Qatari professional football. Br J Sports Med 2013;47:807–8. doi:10.1136/bjsports-2012-091040 [Abstract/FREE Full text]
↵ Gabbett TJ, Domrow N. Risk factors for injury in sub-elite rugby league players. Am J Sports Med 2005;33:428–34. doi:10.1177/0363546504268407 [Abstract/FREE Full text]
↵ Lovell G, Galloway H, Hopkins W, et al. Osteitis pubis and assessment of bone marrow edema at the pubic symphysis with MRI in an elite junior male soccer squad. Clin J Sports Med 2006;16:117–22. doi:10.1097/00042752-200603000-00006 [CrossRef][Medline][Web of Science]Google Scholar
↵ Gastin PB, Meyer D, Huntsman E, et al. Increase in injury risk with low body mass and aerobic-running fitness in elite Australian football. Int J Sports Physiol Perform 2015;10:458–63. doi:10.1123/ijspp.2014-0257 [CrossRef][Medline]Google Scholar
↵ Gabbett TJ, Ullah S, Finch CF. Identifying risk factors for contact injury in professional rugby league players—application of a Frailty model for recurrent injury. J Sci Med Sport 2012;15:496–504. doi:10.1016/j.jsams.2012.03.017 [CrossRef][Medline]Google Scholar
↵ Quarrie KL, Alsop JC, Waller AE, et al. The New Zealand rugby injury and performance project. VI. A prospective cohort study of risk factors for injury in rugby union football. Br J Sports Med 2001;35:157–66. doi:10.1136/bjsm.35.3.157 [Abstract/FREE Full text]
↵ Spencer M, Bishop D, Dawson B, et al. Physiological and metabolic responses of repeated-sprint activities: specific to field based team sports. Sports Med 2005;35:1025–44. doi:10.2165/00007256-200535120-00003 [CrossRef][Medline][Web of Science]Google Scholar
↵ Reilly T, Thomas V. A motion analysis of work-rate in different positional roles in professional football match-play. J Hum Mov Stud 1976;2:887–97. Google Scholar
↵ Gabbett TJ. Sprinting patterns of National Rugby League competition. J Strength Cond Res 2012;26:121–30. doi:10.1519/JSC.0b013e31821e4c60 [CrossRef][Medline]Google Scholar
↵ Baron B, Moullan F, Deruelle F, et al. The role of emotions on pacing strategies and performance in middle and long duration sport events. Br J Sports Med 2011;45:511–17. doi:10.1136/bjsm.2009.059964