
Positional Match Running Performance in Elite Gaelic Football
30(8)/2292–2298 Journal of Strength and Conditioning Research
Malone, Shane; Solan, Barry; Collins, Kieran D.; Doran, Dominic A.
Author Information
1 Research Institute for Sport and Exercise Sciences, Liverpool John Moores University, Henry Cotton Campus, Liverpool, United Kingdom; and
2 Gaelic Sports Research Centre, Department of Science, Institute of Technology Tallaght, Tallaght, Dublin, Ireland
Abstract
There is currently limited information available on match running performance in Gaelic football. The objective of the current study was to report on the match running profile of elite male Gaelic football and assess positional running performance. In this observational study, 50 elite male Gaelic football players wore 4-Hz global positioning systems units (VX Sports) across 30 competitive games with a total of 215 full game data sets collected. Activity was classed according to total distance, high-speed distance (>=17 km·h-1), sprint distance (>=22 km·h-1), mean velocity (km·h-1), peak velocity (km·h-1), and number of accelerations. The average match distance was 8,160 ± 1,482 m, reflective of a relative distance of 116 ± 21 m·min-1, with 1,731 ± 659 m covered at high speed, which is reflective of a relative high-speed distance of 25 ± 9 m·min-1. The observed sprint distance was 445 ± 169 m distributed across 44 sprint actions. The peak velocity was 30.3 ± 1.8 km·h-1 with a mean velocity of 6.5 ± 1.2 km·h-1. Players completed 184 ± 40 accelerations, which represent 2.6 ± 0.5 accelerations per minute. There were significant differences between positional groups for both total running distance, high-speed running distance, and sprint distance, with midfielders covering more total and high-speed running distance, compared with other positions (p < 0.001). There was a reduction in high-speed and sprint distance between the first and second half (p < 0.001). Reductions in running performance were position dependent with the middle 3 positions experiencing the highest decrement in performance. The current study is the first to communicate a detailed description of match running performance during competitive elite Gaelic football match play.
Introduction
The sport of Gaelic football is indigenous to Ireland and is branched within the Gaelic Athletic Association. The sport is played with an amateur ethos super imposed on a professional work ethic (9). Gaelic football is a team-based invasion field game that entails a wide range of offensive and defensive skills to be executed at high speed as play shifts rapidly (38,39). The competitive elite Gaelic football season takes place over an 8-month period. The 2 main competitions are the national league that takes place between February and April and the All-Ireland championship that takes place from May to September. The All-Ireland competition attracts mass national interest with more than 80,000 spectators present at the all-Ireland final (39). Previously, Keane et al. (28) estimated from video-based time-motion analysis that elite-level players cover 8,594 m during competitive play. The estimated distances compare well with recent global positioning systems (GPS) technology analysis (14) that reported players cover 8,815 m with a range of 6,183–11,104 m. Limitations with regard to subjective classification of speed bands and the interobserver definitions for movement classification must be considered before comparison of video analysis studies with GPS studies are made (27,40). Consequently, the nature of video-based motion analysis limits its practical effectiveness in the construction of training drills that replicate the running performance profile of match play.
Without many sport-specific published studies as reference, Gaelic football coaching staff preparing and prescribing training loads will rely on personal experience or anecdotal observations (38). Therefore, inference as to the running performance of players has been appraised from other field sports due to apparent similarities in locomotion characteristics (9,39). Recent technological innovations have made GPS athlete tracking a convenient and popular method to quantify movement patterns and physical demands in sport (2–6,8,14–16). The GPS technology has been used to quantify the running demands of sports such as rugby league (5–7,20,29), rugby union (41), Rugby 7’s (40), and Australian football (2,15,16,30). Johnston et al. (27) reported that GPS seems to be a practically superior athlete-monitoring system in comparison with other methods (e.g., time-motion analysis, hand notation techniques, video-based systems). The technology provides quantitative information on the position, displacement, velocity, and acceleration of field sport athletes, some of which would not be previously obtained from video time-motion analysis alone (18).
Gaelic football, like other field sports, such as Australian football (15,16), rugby league (5–7,20,29) and soccer (10,17) has a degree of positional differentiation regarding running performance profiles. Keane et al. (28) previously reported that the midfield positions covered the greatest distances during match play. Collins et al. (14) observed similar positional differences for high-speed distance (>=17 km·h-1) with midfielders covering a greater distance of match play high intensity in contrast against other positional lines. However, caution must be taken when examining the activity profiles of these studies as positions were only demarcated across 3 specific positional lines (defender, midfielder, forward). With respect to positional running performance analysis, it is important for strength and conditioning coaches to understand all the positional roles within Gaelic football. The training situation needs to be constructed to consider the current tactical roles of each position during match play. Specifically the evolution of the half-backs and half-forwards as “link” players between the attack and defense needs to be considered. There is consequently a need to analyze the running performance of the 5 positional roles (full-back, half-back, midfield, half-forward, full-forward) within Gaelic football match play.
Given the increasing focus on game-specific and position-specific conditioning for players, it is imperative that competition demands are analyzed to better understand both the game-specific and position-specific demands in Gaelic football (11). Consequently, the aims of this study were 2-fold: (a) to examine the match-play running performance of elite Gaelic football players using portable GPS technology and (b) to report the positional differences in running performance across the halves of competitive match play.
Experimental Approach to the Problem
The current observational study was designed to examine match-play running performance of elite Gaelic football players using portable GPS technology to examine positional differences in match-play demands. Fifty intercounty elite Gaelic football players (n = 50) were analyzed across 2 full competition seasons (February to September 2013/2014, February to September 2014/2015) resulting in 215 (n = 215) individual samples being collected. All players analyzed were competing at national league level and All-Ireland championship level. Data were only included if a full match (70 minutes) was completed. Data were classified according to position of play during each individual match (i.e., full-back, half-back, midfield, half-forward, and full-forward). All competitive matches took place between 14.00 and 20.00 hours. Temperatures during match play ranged from 10 to 22° C. The GPS was used to determine specific running performance variables during elite Gaelic football match play. Players were requested to abstain from strenuous physical activity in the 24–48 hours before competitive play. All players were advised to maintain their normal diet, with special emphasis being placed on the intake of fluids and carbohydrates.
Subjects
Fifty elite male Gaelic footballers with a mean (±SD) age (24 ± 4 years), height (180 ± 7 cm), weight (81 ± 7 kg), and years on squad (5 ± 3 years), respectively, volunteered to participate in the study. Players were selected as they were members of the county’s squad that season, and therefore were deemed the best players in the county at the time of data collection. After ethical approval, participants attended an information evening where they were briefed about the purpose, benefits, and procedures of the study. Written informed consent and medical declaration were obtained from participants in line with the procedures set by the local institutions research ethics committee.
Experimental Procedures
The participants wore an individual GPS unit (VX Sport, New Zealand, Issue: 330a, Firmware: 3.26.7.0) sampling at 4 Hz and containing a triaxial accelerometer and magnetometer in a total of 30 games. The GPS unit (mass: 76 g; 48 mm × 20 mm × 87 mm) was encased within a protective harness between the player’s shoulder blades in the upper thoracic-spine region; this ensured that players’ range of movement in the upper limbs and torso was not restricted. The device was activated and satellite lock established for a minimum of 15 minutes before the commencement of each match (34). The GPS technology has been shown to be a valid and reliable way of measuring distance and movement speeds in a range of high-speed, intermittent, contact, and noncontact sports (8,12,13,26,27,35,43). Specifically, the VX Sport GPS unit has more recently been examined by Malone et al. (35) for accuracy and reliability during intermittent activity. Test-retest (7 days apart) reliability for total distance covered, maximum speed, and average speed was quantified. Systematic differences were examined using a paired t-test on the test-retest data and revealed no significant differences for the total distance covered (300.5 ± 3.3; 303.6 ± 5.6 m), maximum speed (23.9 ± 1.9; 24.1 ± 1.3 km·h-1), and average speed (10.2 ± 1.0; 10.2 ± 0.9 km·h-1). The typical error (TE ± 95% confidence interval [CI]) was 0.84 ± 0.3 for total distance covered, 0.75 ± 0.26 for maximum speed, and 0.55 ± 0.19 for average speed, respectively. The coefficient of variation% ± 95% CI was 1.0 ± 0.4 for the total distance covered, 4.2 ± 1.5 for maximum speed, and 4.4 ± 1.5 for average speed, respectively.
Following each match, GPS data were downloaded using the same proprietary software (VX Sport View). Each file was trimmed so that only data recorded when the player was on the field was included for further analysis. The proprietary software provided instantaneous raw velocity data at 0.25-second intervals, which was then exported and placed into a customized Microsoft Excel spreadsheet (Microsoft, Redmond, WA, USA). The spreadsheet allowed analysis of distance covered (meter) in the following categories: total distance, high-speed distance (>=17 km·h-1), and sprint distance (>=22 km·h-1). The peak and mean velocity (km·h-1) were also recorded. An acceleration was classified once a participant changed speed by 2 km·h-1 within 1 second. The change was triggered over a minimum time of 2 seconds (to demarcate a lunge from a sprint). The acceleration stopped when the player decelerated to 75% of maximum speed reached in the preceding acceleration effort.
Statistical Analyses
Data are presented as mean ± SD with and 95% CI. Descriptive analysis and assumptions of normality were verified before parametric
statistical analysis. A multivariate analysis of variance was used to compare differences in running performance variables between
positional groups and playing half. The dependant variables across the range of analysis were total distance (m), high-speed distance (m;
>=17 km·h-1), sprint distance (m; >=22 km·h-1), mean velocity (km·h-1), peak velocity (km·h-1), and number of accelerations (n) with playing
position and match periods (e.g., first and second half) independent variables. When significant main effects were observed, a
Scheffe’s post hoc test was applied. Standardized effect sizes (ES) were calculated with 0.2, 0.21–0.6, 0.61–1.20, 1.21–2.00, and
2.01–4.0 representing trivial, small, moderate, large, and very large differences, respectively (24). All statistical analyses were
performed using SPSS for Windows (Version 22; SPSS Inc., Chicago, IL, USA) with statistical significance set at an accepted level of p < =
0.05.
Results
Selected running performance variables for each playing position are shown in Table 1. Independent of position the mean distance covered during match play was 8,160 ± 1,482 m, which equates to a relative work rate of 116 ± 21 m·min-1. The high-speed distance of players was 1,731 ± 659 m, which equates to a relative high-speed running distance of 25 ± 9 m·min-1. Players undertook 184 ± 40 accelerations, which equates to a relative acceleration number of 2.6 ± 0.5 accelerations per minute. The sprint distance analysis indicates that players cover 445 ± 269 m across 40 sprints. The peak velocity of players was 30.3 ± 1.8 km·h-1 with a mean velocity of 6.5 ± 1.2 km·h-1.
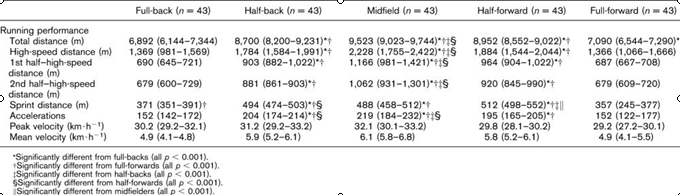
Table 1 . The running performance metrics with respect of playing position (mean
+/- 95% CI).
High-speed distance (>=17 km[middle dot]h-1); sprint distance (>=22 km[middle dot]h-1).
The analysis of variance revealed significant main effects for playing position (F = 11.8, p < 0.001). Post hoc analysis revealed that midfielders covered a greater total distance compared with all other positions (ES = 0.72–1.39). Similarly, midfielders also had higher relative distances compared with all other positions (ES = 0.71–2.14), whereas higher values were observed for half-forwards and half-backs compared with full-forwards (ES = 1.25) and full-backs (ES = 1.06) only. Midfielders, half-backs, and half-forwards also had greater high-speed distance compared with all other positions (ES = 0.80–2.37). Similar trends were observed for sprint distance (ES = 0.65–3.46) with midfielders, half-forwards, and half-backs covering higher distances compared with all other positions. Full-forwards had less accelerations compared with all other positions (ES = 1.34–2.37). Midfielders and half-backs had a higher number of accelerations compared with full-back, full-forward, and half-forward positions (ES = 1.10–2.45). Further analysis revealed no significant main effects for playing position for peak and mean speeds.
A significant main effect for the half of play (F = 7.26, p < 0.001) was observed. Post hoc analyses revealed that the high-speed distance in the second half (ES = 0.28; 0.29) reduced compared with the opening half (p = 0.023). Figure 1 shows the temporal changes in high-speed distance with respect of position. A significant effect for position (F = 6.11, p < 0.001) revealed that midfielders had a greater high-speed distance decrement compared with all other positions (ES = 0.82–2.39). Half-forwards experienced significantly (p = 0.002) higher decrement in high-speed distance compared with full-forwards (ES = 1.35) and full-backs (ES = 1.16) only. Figure 2 shows the temporal changes in sprint distance with respect to position. Significant main effects for position were revealed (F = 6.11, p < 0.001), with half-backs and midfielders having higher sprint distance decrement when compared with other positions (ES = 0.92–2.19). No significant main effects were observed for playing position for total distance between halves.
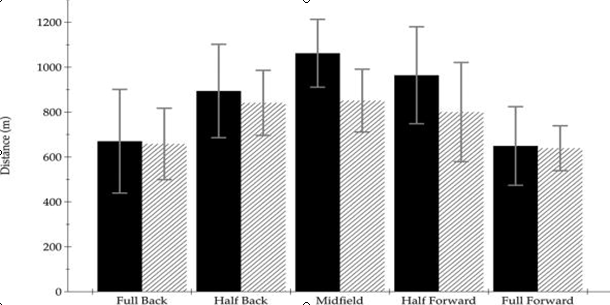
Figure 1 . Temporal changes in match-play high-speed distance (>17 km[middle dot]h-1) across halves of play.
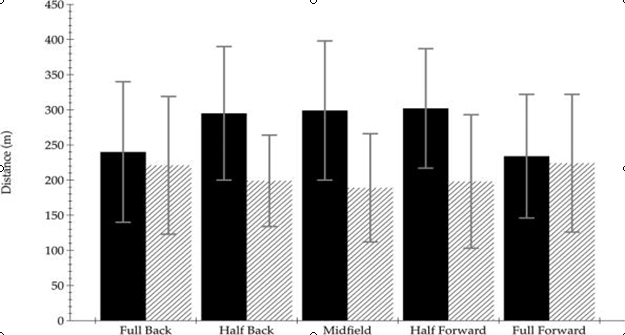
Figure 2 . Temporal changes in match-play sprint distance (>22 km[middle dot]h-1) across halves of play.
Discussion
The aim of the current study was to analyze the running performance of elite Gaelic football using GPS technologies. Currently, there is a dearth of up-to-date information related to the running performance of elite Gaelic football players; therefore, cross comparison of the findings to previous literature is challenging. The current study examined running performance of elite Gaelic football players. The results show that there were positional differences in distances traveled across various speed zones. Additionally, reductions in both high-speed and sprint distances were observed between halves of play. It is evident that Gaelic football running performance consists of interwoven generic movement with players completing low-speed running interspersed with high-speed running. The current study is the first to report a detailed description of match running performance across the 5 positional lines in elite Gaelic football.
Independent of position, the total distance covered during match play was 8,160 ± 1,482 m, this is marginally lower than previous studies (14) that reported total distances of 8,815 ± 1,287 m. Players covered 1,731 ± 659 m at high speed, classed by an arbitrary figure >=17 km·h-1, the current data are marginally higher than previously observed in Gaelic football (1,695 ± 503 m) (14). Comparative analysis of relative outputs (meter per minute) suggests that Gaelic football players compare well with their professional counterparts in other invasion-based field sports. Gaelic football locomotion (116 m·min-1) is similar to that reported for soccer match play (118 m·min-1) (42), higher than that reported for rugby league back line players (89 m·min-1) (6,7,20) and lower than that reported for Australian football players (127 m·min-1) (16). Careful consideration must be given here to difference in playing number, size of pitch, and the rules of each specific game, all of which will influence findings in addition, to the variation in speed thresholds across studies for high-speed distance (23,25).
Sprint actions have been reported to have a positive effect on match outcomes within soccer (23,25). In the current study, independent of position, players on average sprinted 445 ± 169 m distributed over ~44 sprints. It is difficult to compare the figures definitively given that the demarcation of sprinting velocities varies across studies from 18 to 30 km·h-1 (23). Peak velocity has been shown to be an important reproducible performance requirement for players within field sports (31). No significant differences were noted across maximum velocity attributes of players suggesting a nonpositional-specific threshold of velocity for elite match play.
Previous studies have attempted to analyze the positional profiles of Gaelic football players by 3 distinct positional roles (defender, midfielder, and forward) (14,28). The evolution of tactical roles means there is a need to further differentiate positions into 5 distinctly separate positional roles.
The current study is the first to differentiate players into the 5 positional roles. Similar to previous studies in soccer (10,17,21,37), rugby league (5,6,20), and Australian football (2,15,16,19) positional differences for running performance during elite Gaelic football were observed. Specifically, midfielders covered greater total distance compared with other playing positions; also, high-speed distances were greater for midfielders as well as half-forwards and half-backs in comparison with full-forwards and full-backs. The current results are comparable with those that have been reported previously during Australian football competition play (15,16). A temporal change with respect to high-speed distance and sprint distance was observed. Results indicate that both high-speed distance and sprint distance are reduced in the second half of match play. Trends similar to this are also evident in soccer (10,33,44) with a drop in sprinting, and high-intensity running reported in the period after half-time.
A reduction in work rate in the second half have been found during elite-level Australian football matches (15,16) and attributed to a reduction in glycogen stores (45), this may suggest a need for nutritional resupplementation strategies during the half-time period. A brief re-warm-up after half-time may also be necessary to attenuate the decrement in high-speed and sprint distance covered. An active re-warm-up strategy during half-time has shown to be effective in improving performance in sports of similar nature (32,33), and therefore should be considered in the case of Gaelic football.
The decrement in running performance observed in the current study was position specific with the middle 3 positional roles (half-back, midfield, and half-forwards) exhibiting the highest decrement across running performance variables. Midfield players (11%) experienced the highest decrement in total running performance across halves of play followed by half-back (10.3%) and half-forward lines (8.2%). A nonsignificant decrement was observed for both full-back (0.2%) and full-forward lines (2.5%). The current findings are similar to those observed in Australian football (15,16) and soccer (10). The positional differences in running performance may be explained by the specific tactical roles of each playing position. Midfielders, half-backs, and half-forwards are more nomadic than other positions because of their transitional role in both attack and defensive situations, which allows them greater freedom to complete higher distances and consequently accrue higher decrements in running performance.
It is not possible to determine if the observed decrement can be linked to metabolic or central nervous system fatigue or even pacing strategies employed by players throughout match activities (2). The findings from the current study show that positional roles play an important role in determining the amount of running involvement during match play. The training of elite players needs to reflect these positional differences.
The results of this study need to be interpreted within the context of the study limitations. No measure of collision events, shouldering, tackling, breaking tackles, and blocking were included in this study. It is, however, clear that such collisions incur a large physiological demand (6,7,19,20) and significantly increase match intensity. The impact of these elements was not quantified in the current study, and therefore future research related to these elements of match-play demand is warranted. Furthermore, in this study, match dynamics (winning and losing team) and styles of play were not analyzed. This could provide additional information into how match outcome and running performance interact. Additionally, the match-to-match variation in running performance must be considered, variance across activity profiles has been shown in soccer (22,37).
Future studies in Gaelic football should aim to assess the match-to-match variability for running performance thresholds for Gaelic football. The temporal nature of running performance needs to be assessed across position with respect to quarters of play. Furthermore, each player is biologically different in both stature and physical capacity; with this in mind, the authors advocate the development of individualized player-specific running thresholds as seen in soccer (1). Finally, future research should consider the current advancements in the understanding of team sport activity profiles and the known importance of accelerations and decelerations (36), as such analysis of the metabolic power profile of Gaelic football should be undertaken to help our understanding of the energetic cost associated with competitive match play.
Practical Applications
Training specificity is important for stimulating training adaptations to improve match performance. Understanding the running performance demands of a sport is therefore of paramount importance for strength and conditioning coaches. Despite this, few data are currently available on the match-play running demands of elite level Gaelic football. To provide relevant up-to-date data on match play, the current study examined the match running performance of elite Gaelic football players. The main findings were that positional differences exist in elite Gaelic football. Midfielders, half-forwards, and half-backs had greater activity profiles compared with other position groups. Second, there was observed a distinct positional temporal decrement in high-speed and sprint distance across halves of play. Analysis of the findings highlights the need for position-specific physical conditioning drills that replicate the running performances observed during the current study. The temporal decrement in high-speed and sprint distance after half-time is also of practical significance to coaches; therefore a half-time active re-warm-up and between half nutritional supplementation may be required in elite Gaelic football to attenuate the decrement in running performance observed. Overall, coaches should consider the positional running profile of players and the subsequent decrement in running performance to better optimize training outcomes for match day running performance.
References
1. Abt G, Lovell R. The use of individualized speed and intensity thresholds for determining the distance run at high-intensity in professional soccer. J Sports Sci 27: 893–898, 2009. Bibliographic Links [Context Link]
2. Aughey RJ. Australian football player work rate: Evidence of fatigue and pacing. Int J Sports Physiol Perform 5: 394–405, 2010. [Context Link]
3. Aughey RJ. Applications of GPS technologies to field sports. Int J Sports Physiol Perform 6: 295–310, 2011. [Context Link]
4. Aughey RJ, Falloon C. Real-time versus post-game GPS data in team sports. J Sci Med Sport 13: 348–349, 2010. Bibliographic Links [Context Link]
5. Austin D, Gabbett T, Jenkins D. Repeated high-intensity exercise in a professional rugby league. J Strength Cond Res 25: 1898–1904, 2011. Ovid Full Text Bibliographic Links [Context Link]
6. Austin DJ, Kelly SJ. Positional differences in professional rugby league match play through the use of global positioning systems. J Strength Cond Res 27: 14–19, 2014. Ovid Full Text Bibliographic Links [Context Link]
7. Austin DJ, Kelly SJ. Professional rugby league positional match play analysis through the use of global positional system. J Strength Cond Res 28: 187–193, 2014. Ovid Full Text Bibliographic Links [Context Link]
8. Barbero-Alverez JC, Coutts AJ, Granda J, Barbero-Alverez V, Castanga C. The validity and reliability of a global positioning satellite system device to assess speed and repeated sprint ability (RSA) in athletes. J Sci Med 13: 232–235, 2010. [Context Link]
9. Beasley KJ. Nutrition and gaelic football: Review and recommendations and future considerations. Int J Sport Nutr Exerc Metab 25: 1–13, 2015. Bibliographic Links [Context Link]
10. Bloomfield J, Polman R, O’Donoghue P. Physical demands of different positions in FA premier league soccer. J Sports Sci Med 6: 63–70, 2007. [Context Link]
11. Brown J, Waller M. Needs analysis, physiological response, and program guidelines for Gaelic football. Strength Cond J 36: 73–81, 2014. [Context Link]
12. Buchheit M, Allen A, Poon TK, Mondonutti M, Gregson W, Di Salvo V. Integrating different tracking systems in football: Multiple camera semi-automatic system, local positioning measurement and GPS technologies. J Sports Sci 32: 1844–1857, 2014. Bibliographic Links [Context Link]
13. Castellano J, Casamichana D, Calleja-González J, San Román J, Ostojic SM. Reliability and accuracy of 10 Hz GPS devices for short-distance exercise. J Sports Sci Med 10: 233–234, 2011. [Context Link]
14. Collins DK, Solan B, Doran DA. A preliminary investigation into high-intensity activity during elite Gaelic football. J Sports Ther 10: 1–5, 2013. [Context Link]
15. Coutts AJ, Kempton T, Sullivan C, Bilsborough J, Cordy J, Rampinini E. Metabolic power and energetic costs of professional Australian football match-play. J Sci Med Sport 18: 219–224, 2015. Bibliographic Links [Context Link]
16. Coutts AJ, Quinn J, Hocking J, Castangna C. Match running performance in elite Australian rules football. J Sci Med Sport 13: 543–548, 2010. Bibliographic Links [Context Link]
17. Di Salvo V, Baron R, Gonzalez-Haro C, Gormasz C, Pigozzi F, Bachle N. Sprinting analysis of elite soccer players during European Champions League and UEFA cup matches. J Sports Sci 14: 1–6, 2010. [Context Link]
18. Dwyer DB, Gabbett TJ. Global positioning system data analysis: Velocity ranges and a new definition of sprinting for field sport athletes. J Strength Cond Res 26: 818–824, 2012. Ovid Full Text Bibliographic Links [Context Link]
19. Edgecomb SJ, Norton KI. Comparison of global positioning and computer-based tracking systems for measuring player movement distance during Australian football. J Sci Med Sport 9: 25–32, 2006. Bibliographic Links [Context Link]
20. Evans SD, Brewer C, Haigh JD, Lake M, Morton JP, Close GL. The physical demands of super league rugby: Experiences of newly promoted franchise. Eur J Sport Sci 15: 505–513, 2015. [Context Link]
21. Gaudino P, Iaia FM, Alberti G, Atkinson G, Strudwick AJ, Gregson W. Monitoring training in elite soccer players: Systematic bias between running speed and metabolic power data. Int J Sports Med 34: 963–968, 2013. Bibliographic Links [Context Link]
22. Gregson W, Drust B, Atkinson G. Match to match variability in high speed activities in premier league soccer. Int J Sports Med 31: 237–242, 2010. Bibliographic Links [Context Link]
23. Haugen T, Tønnessen E, Hisdal J, Seiler S. The role and development of sprinting speed in soccer. Int J Sports Physiol Perform 9: 432–441, 2014. [Context Link]
24. Hopkins WG. Measures of validity. In: A New View of Statistics. Internet Society for Sport Science. 2001. Available at:
http://www.sportsci.org/resource/stats/index.html
. Accessed July 8, 2015. [Context Link]
25. Ingebrigtsen J, Dalen T, Hjelde GH, Drust B, Wisløff U. Acceleration and sprint profiles of a professional elite football team in match play. Eur J Sport Sci 15: 101–110, 2015. [Context Link]
26. Jennings D, Cormack S, Coutts AJ, Boyd LJ, Aughey RJ. The validity and reliability of GPS units for measuring distance in team sport specific running patterns. Int J Sports Physiol Perform 5: 328–341, 2010. [Context Link]
27. Johnston RJ, Watsford ML, Pine MJ, Spurrs RW, Murphy AJ, Pruyn EC. The validity and reliability of 5-Hz global positioning system units to measure team sport movement demands. J Strength Cond Res 26: 758–765, 2012. Ovid Full Text Bibliographic Links [Context Link]
28. Keane S, Reilly T, Hughes M. Analysis of work-rates in Gaelic football. Aus J Sci Med Sport 25: 100–102, 1993. [Context Link]
29. Kempton T, Sirotic AC, Rampinini E, Coutts AJ. Metabolic power demands of rugby league match play. Int J Sports Physiol Perform 10: 23–28, 2015. [Context Link]
30. Loader J, Montgomery PG, Williams MD, Lorenzen C, Kemp JG. Classifying training drills based on movement demands in Australian football. Int J Sports Sci Coach 7: 57–67, 2012. [Context Link]
31. Lockie RG, Murphy AJ, Schultz AB, Knight TJ, Janse de Jonge XA. The effects of different speed training protocols on sprint acceleration kinematics and muscle strength and power in field sport athletes. J Strength Cond Res 26: 1539–1550, 2012. Ovid Full Text Bibliographic Links [Context Link]
32. Lovell RJ, Barrett S, Portas M, Weston M. Re-examination of the post half-time reduction in soccer work-rate. J Sci Med Sport 16: 250–254, 2013. Bibliographic Links [Context Link]
33. Lovell RJ, Midgley A, Barrett S, Carter D, Small K. Effects of different half-time strategies on second half soccer-specific speed, power and dynamic strength. Scand J Med Sci Sports 23: 105–113, 2013. Bibliographic Links [Context Link]
34. Maddison R, Ni Mhurchu C. Global positioning system: A new opportunity in physical activity measurement. Int J Behav Nutr Phys Act 6: 73, 2009. [Context Link]
35. Malone S, Collins DK, McRobert AP, Morton J, Doran DA. Accuracy and reliability of VXsport global positioning system in intermittent activity. Proceedings of the 19th Annual Congress of the European College of Sport Science; July 2–5, 2014; Amsterdam, the Netherlands. [Context Link]
36. Osgnach C, Poser S, Bernardini R, Rinaldo R, di Prampero PE. Energy cost and metabolic power in elite soccer: A new match analysis approach. Med Sci Sports Exerc 42: 170–178, 2009. Ovid Full Text Bibliographic Links [Context Link]
37. Rampinini E, Coutts AJ, Castagna C, Sassi R, Impellizzeri FM. Variation in top level soccer match performance. Int J Sports Med 28: 1018–1024, 2007. Bibliographic Links [Context Link]
38. Reilly B, Akubat I, Lyons M, Collins DK. Match-play demands of elite youth Gaelic football using global positioning system tracking. J Strength Cond Res 29: 989–996, 2015. Ovid Full Text Bibliographic Links [Context Link]
39. Reilly T, Collins K. Science and the Gaelic sports: Gaelic football and hurling. Eur J Sport Sci 8: 231–240, 2008. [Context Link]
40. Ross A, Gill N, Cronin J. The match demands of international rugby sevens. J Sport Sci 33: 1035–1041, 2015. [Context Link]
41. Suarez Arrones L, Galvez J, Diaz Rodriguex I, Arriaza Gil C. Intermittent performance in youth rugby union players and reliability of the GPS device to assess RSA with changes in direction. J Sport Health Res 5: 105–116, 2013. [Context Link]
42. Suarez Arrones L, Torreno N, Requena B, de Villareal ES, Casamichana D, Barbero Alvarez JC, Munguia Izquierdo D. Match play activity profile in professional soccer players during official games and the relationship between internal and external load. J Sports Med Phys Fitness 55: 1414–1422, 2015. [Context Link]
43. Waldron M, Worsfield P, Twist C, Lamb K. Concurrent validity and test-retest reliability of a global positioning system (GPS) and timing gates to assess sprint performance variables. J Sports Sci 29: 1613–1619, 2011. Bibliographic Links [Context Link]
44. Weston M, Batterham AM, Castangna C, Portas MD, Barnes C, Harley J, Lovell RJ. Reduction in physical match performance at start of second half in elite soccer. Int J Sports Physiol Perform 6: 174–182, 2011. [Context Link]
45. Williams C, Rollo I. Carbohydrate nutrition and team sport performance. Sports Med 45: 13–22, 2015. Ovid Full Text [Context Link]
Key Words: GPS; match analysis; team sport; intermittent exercise